Large Mission Corridor: Earth to Mars

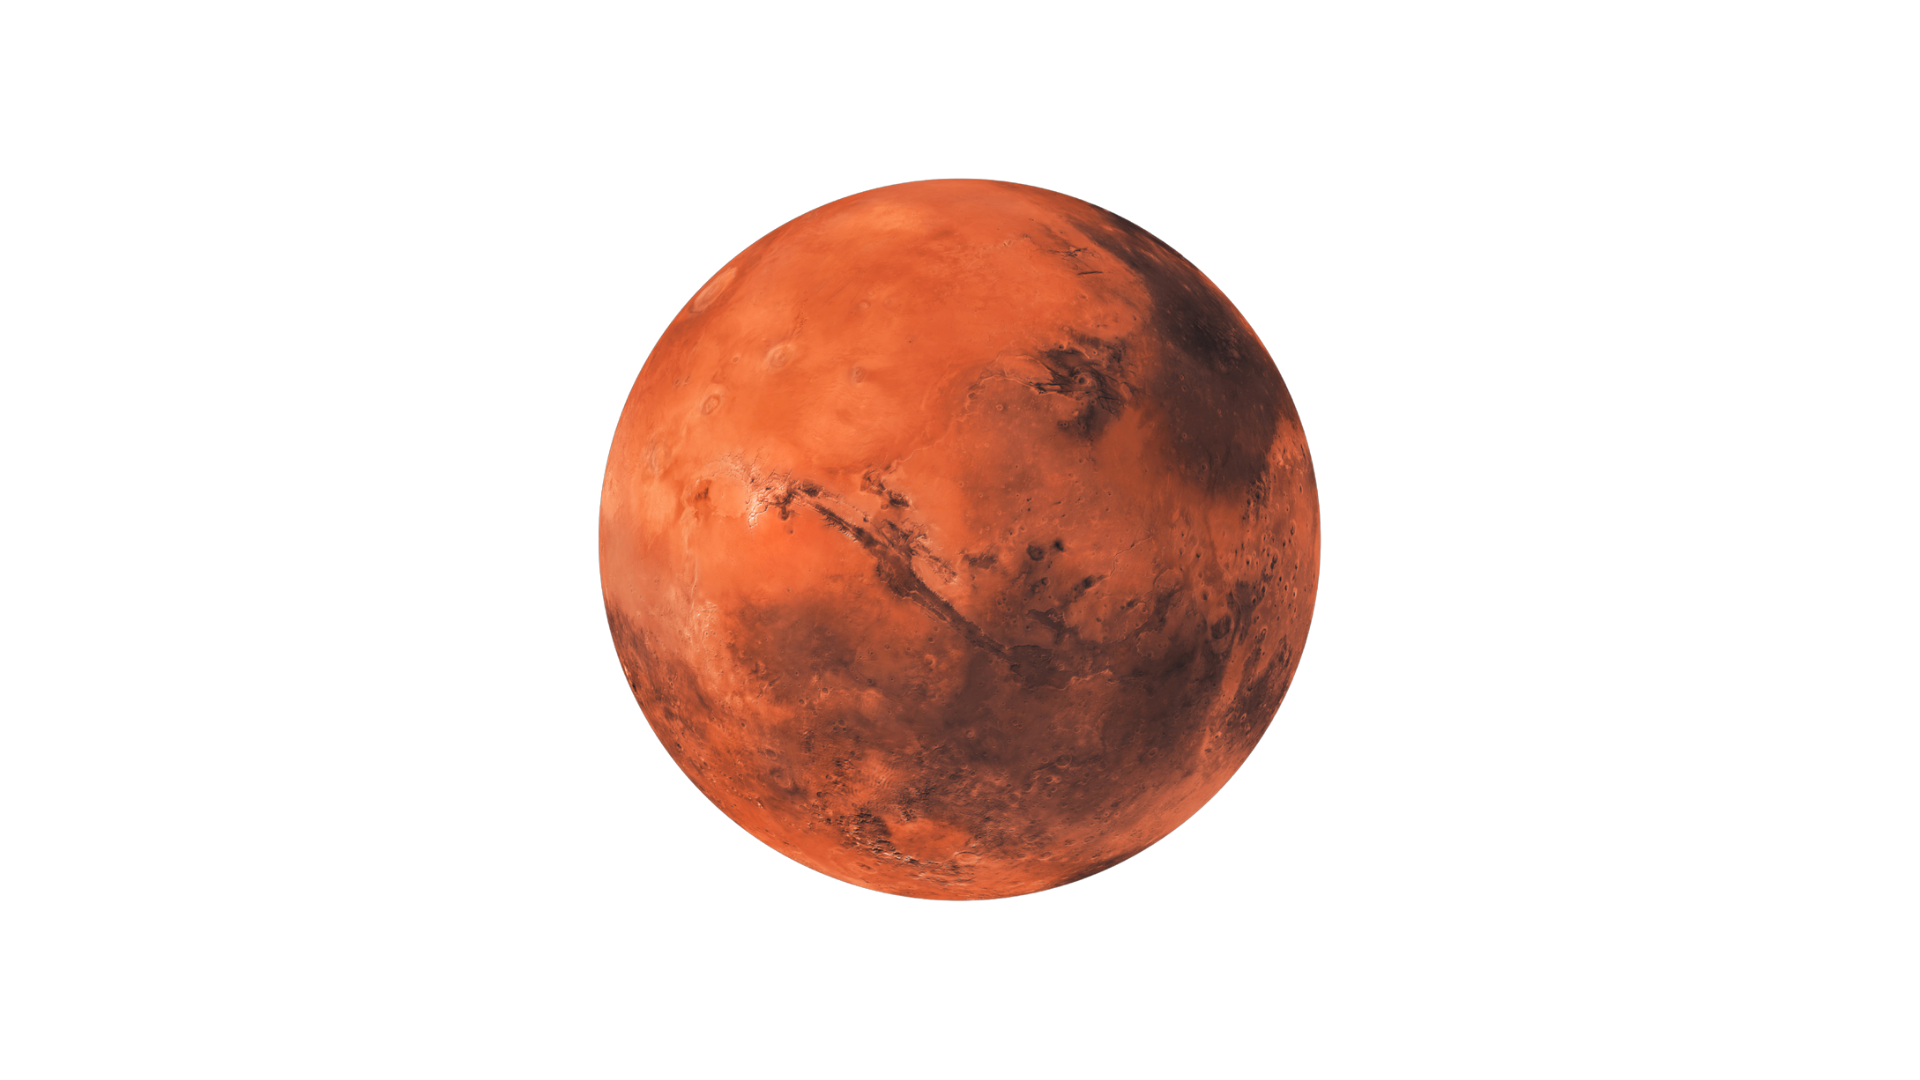
Earth
Mars
Distance Earth-Mars: 225,000,000 km
Mission Progress: 0.0%
Simulated Distance Covered: 0 km
Distance Remaining: 225,000,000 km
Current Phase: Standby
Arrival Lock: Not locked
Theoretical Speed Limit Panel
Physical Speed Limit: 299,792,458 m/s
Same Limit: 299,792.458 km/s
Simulator Target Mode: 1% c test mode
Theoretical Speed Setting: 0 m/s
Percent of Light Speed: 0%
Light-Speed Trip Estimate: 12.51 minutes
Same Limit: 299,792.458 km/s
Simulator Target Mode: 1% c test mode
Theoretical Speed Setting: 0 m/s
Percent of Light Speed: 0%
Light-Speed Trip Estimate: 12.51 minutes
c = 299,792,458 m/s
This panel allows a theory-only speed limit up to c.
It does not claim any real ship can reach light speed.
This panel allows a theory-only speed limit up to c.
It does not claim any real ship can reach light speed.
Live Time Synchronization
Current Local Time: --
UTC Time: --
Atomic Time Proxy: --
CST Ship Time: --
Interstellar Time Index: --
Clock Drift ΔT: 0.000000 s
UTC Time: --
Atomic Time Proxy: --
CST Ship Time: --
Interstellar Time Index: --
Clock Drift ΔT: 0.000000 s
ΔT = T_ship − T_atomic
CST correction = −kΔT
Goal: |ΔT| ≤ δt
CST correction = −kΔT
Goal: |ΔT| ≤ δt
1% Light-Speed Mars Target
Speed of Light: 299,792 km/s
Target Speed: 1% c ≈ 2,997.92 km/s
Program Speed Readout: 0 km/s
Percent of Light Speed: 0%
Estimated Trip at 1% c: 20.8 hours
Current Simulated Trip Estimate: Calculating...
Target Speed: 1% c ≈ 2,997.92 km/s
Program Speed Readout: 0 km/s
Percent of Light Speed: 0%
Estimated Trip at 1% c: 20.8 hours
Current Simulated Trip Estimate: Calculating...
T = D / v
225,000,000 km ÷ 2,997.92 km/s = 75,052 s ≈ 20.8 hr
225,000,000 km ÷ 2,997.92 km/s = 75,052 s ≈ 20.8 hr
Hybrid Engine Stack Live Readings
Nuclear Thermal Reactor: 0%
Electric / Ion Thruster: 0%
Plasma Fusion Burst: 0%
Warp Field Generator Proxy: 0%
Timing Layer + Particle Separation
Electron Timing Response: 0.000 MHz
Ion Timing Response: 0.000 kHz
Neutron / Neutral Channel: Standby
Ionization Level: 0% Charged Particle Capture: 0% Neutral Loss Channel: 0% Usable Plasma Output: 0%
Ion Timing Response: 0.000 kHz
Neutron / Neutral Channel: Standby
Ionization Level: 0% Charged Particle Capture: 0% Neutral Loss Channel: 0% Usable Plasma Output: 0%
Magnetic Vortex Container
Vortex Rotation Rate: 0 rpm
Magnetic Cage Strength: 0%
Centerline Stability: 0%
Rear Magnetic Nozzle: Closed
Plasma Exhaust Coherence: 0%
Magnetic Cage Strength: 0%
Centerline Stability: 0%
Rear Magnetic Nozzle: Closed
Plasma Exhaust Coherence: 0%
Generated Computer Image: Magnetic Vortex Formation
Generated image logic: dots = charged particles, rings = magnetic containment, centerline = stable vortex axis, rear flow = directed propulsion.
Generated Computer Image: Particle Separation + Stability + Thrust
Blue/green dots = charged particles captured by fields. Amber/red dots = neutral loss or heat channel.
Rear stream shows thrust coherence.
Theoretical Prediction Validation Panel
1. Magnetic Vortex Formation
Vortex RPM: 0Exhaust Coherence: 0%
Result: Waiting
2. Particle Separation
Charged Capture: 0%Neutral Loss: 0%
Result: Waiting
3. Timing-Controlled Stability
CST Drift: 0 sStability: 0%
Result: Waiting
4. Thrust Efficiency
Usable Plasma: 0%Control Efficiency: 0%
Result: Waiting
5. Mars Arrival Lock
Intercept Error: 0 kmArrival State: Not locked
Result: Waiting
Curvature Near/Far Field Monitor
Curvature Near Earth: 0.000000
Corridor Curvature Midpoint: 0.000000
Curvature Near Mars: 0.000000
Compression Proxy Ahead: 0%
Expansion Shock Proxy Behind: 0%
Natário Zero-Expansion Status: Standby
Corridor Curvature Midpoint: 0.000000
Curvature Near Mars: 0.000000
Compression Proxy Ahead: 0%
Expansion Shock Proxy Behind: 0%
Natário Zero-Expansion Status: Standby
Voyager Triangle Heading Correction
Earth Reference Signal: Locked
Voyager 1 Timing Bias: 0.000000
Voyager 2 Timing Bias: 0.000000
Heading Error: 0.000°
Correction Burn: 0.000%
Mars Intercept Error: 0 km
Voyager 1 Timing Bias: 0.000000
Voyager 2 Timing Bias: 0.000000
Heading Error: 0.000°
Correction Burn: 0.000%
Mars Intercept Error: 0 km
Beginning Speed / Ending Speed
Beginning Speed: 0 km/s
Current Speed: 0 km/s
Target Cruise Speed: 2,997.92 km/s
Ending Approach Speed: 0 km/s
Acceleration Phase: Standby
Deceleration Phase: Standby
Current Speed: 0 km/s
Target Cruise Speed: 2,997.92 km/s
Ending Approach Speed: 0 km/s
Acceleration Phase: Standby
Deceleration Phase: Standby
Energy and Mass Conversion Proxy
Source Energy Proxy: 0 J
Usable Energy Proxy: 0 J
Equivalent Mass Proxy m = E/c²: 0 kg
Control Efficiency: 0%
QOE Optimization Score: 0%
Usable Energy Proxy: 0 J
Equivalent Mass Proxy m = E/c²: 0 kg
Control Efficiency: 0%
QOE Optimization Score: 0%
Thermal / Stress / Safety Monitor
Reactor Heat Load: 0%
Plasma Chamber Stress: 0%
Field Stability: 100%
Nozzle Thermal Status: Safe
Safety Status: Safe
Plasma Chamber Stress: 0%
Field Stability: 100%
Nozzle Thermal Status: Safe
Safety Status: Safe
Live Automatic Adjustments
Waiting for mission start...
Flight Phase Logic
| Progress | Phase | Primary Action |
|---|---|---|
| 0–10% | Earth Departure | Nuclear ramp + ion alignment |
| 10–35% | Acceleration | Hybrid engine builds toward 1% c |
| 35–75% | CST Cruise | Clock-locked high-speed corridor |
| 75–92% | Mars Prep | Plasma correction + deceleration |
| 92–100% | Mars Arrival | Dot stops at Mars arrival lock |
Full CST 8-Layer Engine Timing Diagram
Layer 1 — Energy Scale
Defines available energy using E = mc². This is a source limit, not free energy.
Layer 2 — Energy Density
Measures energy inside the reactor, plasma chamber, magnetic cage, and nozzle volume.
Layer 3 — Stress-Energy Structure
Organizes energy density, pressure, thermal load, plasma flow, and field stress.
Layer 4 — Curvature Proxy
Represents compression ahead, expansion behind, and stable corridor shaping.
Layer 5 — Proper Time
Tracks internal CST ship time compared with the atomic reference outside the vehicle.
Layer 6 — Measurement Clocks
Uses local time, UTC, atomic proxy time, CST ship time, and interstellar index.
Layer 7 — Synchronization Error
Computes ΔT = T_ship − T_atomic and controls drift.
Layer 8 — CST Control Objective
Uses timing, heading, ionization, plasma separation, and safety limits to stabilize the engine.
Where timing acts: Atomic time controls outside navigation reference.
CST time controls inside ship stability. The timing layer decides when to pulse fields,
separate particles, reject neutral loss, open the magnetic nozzle, and correct heading.